

In our never-ending quest to improve and expand our deal sourcing, I recently started a project to ingest GitHub data and see what we can find there. We already have a number of portfolio companies that began as OS projects, such as Mermaid Chart, creators of Mermaid.js, and Pydantic, both of which are used by or directly impact millions of people. In total, around 20% of our portfolio companies began as OS projects before becoming actual companies, another 20% started their companies with the main technology built as open-source, and a good chunk of the rest are building at least some part of their product in the open. The prominence of OS in the dev tools / dev infrastructure space is no surprise, and our own investments further support that. It's also why we think there's a lot of sourcing potential in ingesting data from open-source ecosystems, starting with Github, but also Gitlab and others.
There's lots to be said and argued on the subject of open source - its definition and the various licenses, creator/user relationships, the role of commercial entities in the ecosystem, whether startups should OS their projects and more. I'm not going to delve into that in this post, but for clarification, when I refer to open-source I'm using the layperson definition and including things like open-core and source-available.
Now the fun stuff! As part of my work on this project, I also cooked up some fun charts and tables around the most popular repos on GitHub, measured simply by star count. All the data and code can be accessed in this project. Feel free to run yourself or create your own charts.
I gathered the list of repos in Github over the past 5 years with more than 100 stars. Naturally, we expect as more time passes more repos will cross that mark, and that's indeed what we get:
I also plotted this out to see the growth over time
No idea what’s up with the the yearly peaks in the early months (Feb/March/April). I thought I had duplicate data at first, but that wasn't the case. If anyone has any theories I'd love to hear them. Might just be noise, seeing as it’s not quite as prevalent in the 5,000 star line.
Looking at the total over the last 5 years, we have:
127k repos with 100 stars in 5 years is pretty crazy to me. Something something "networks". I’d be curious to get some data of user growth, and growth in user propensity to star projects or engage with Github in a more social way. I also wonder if “fake” stars contribute here meaningfully. This is relevant because star count is used as a proxy for popularity/traction/growth, particularly in pitch decks. There’s a great post from Dagster where they measure “fake” stars in projects and dig into the Github star black market.
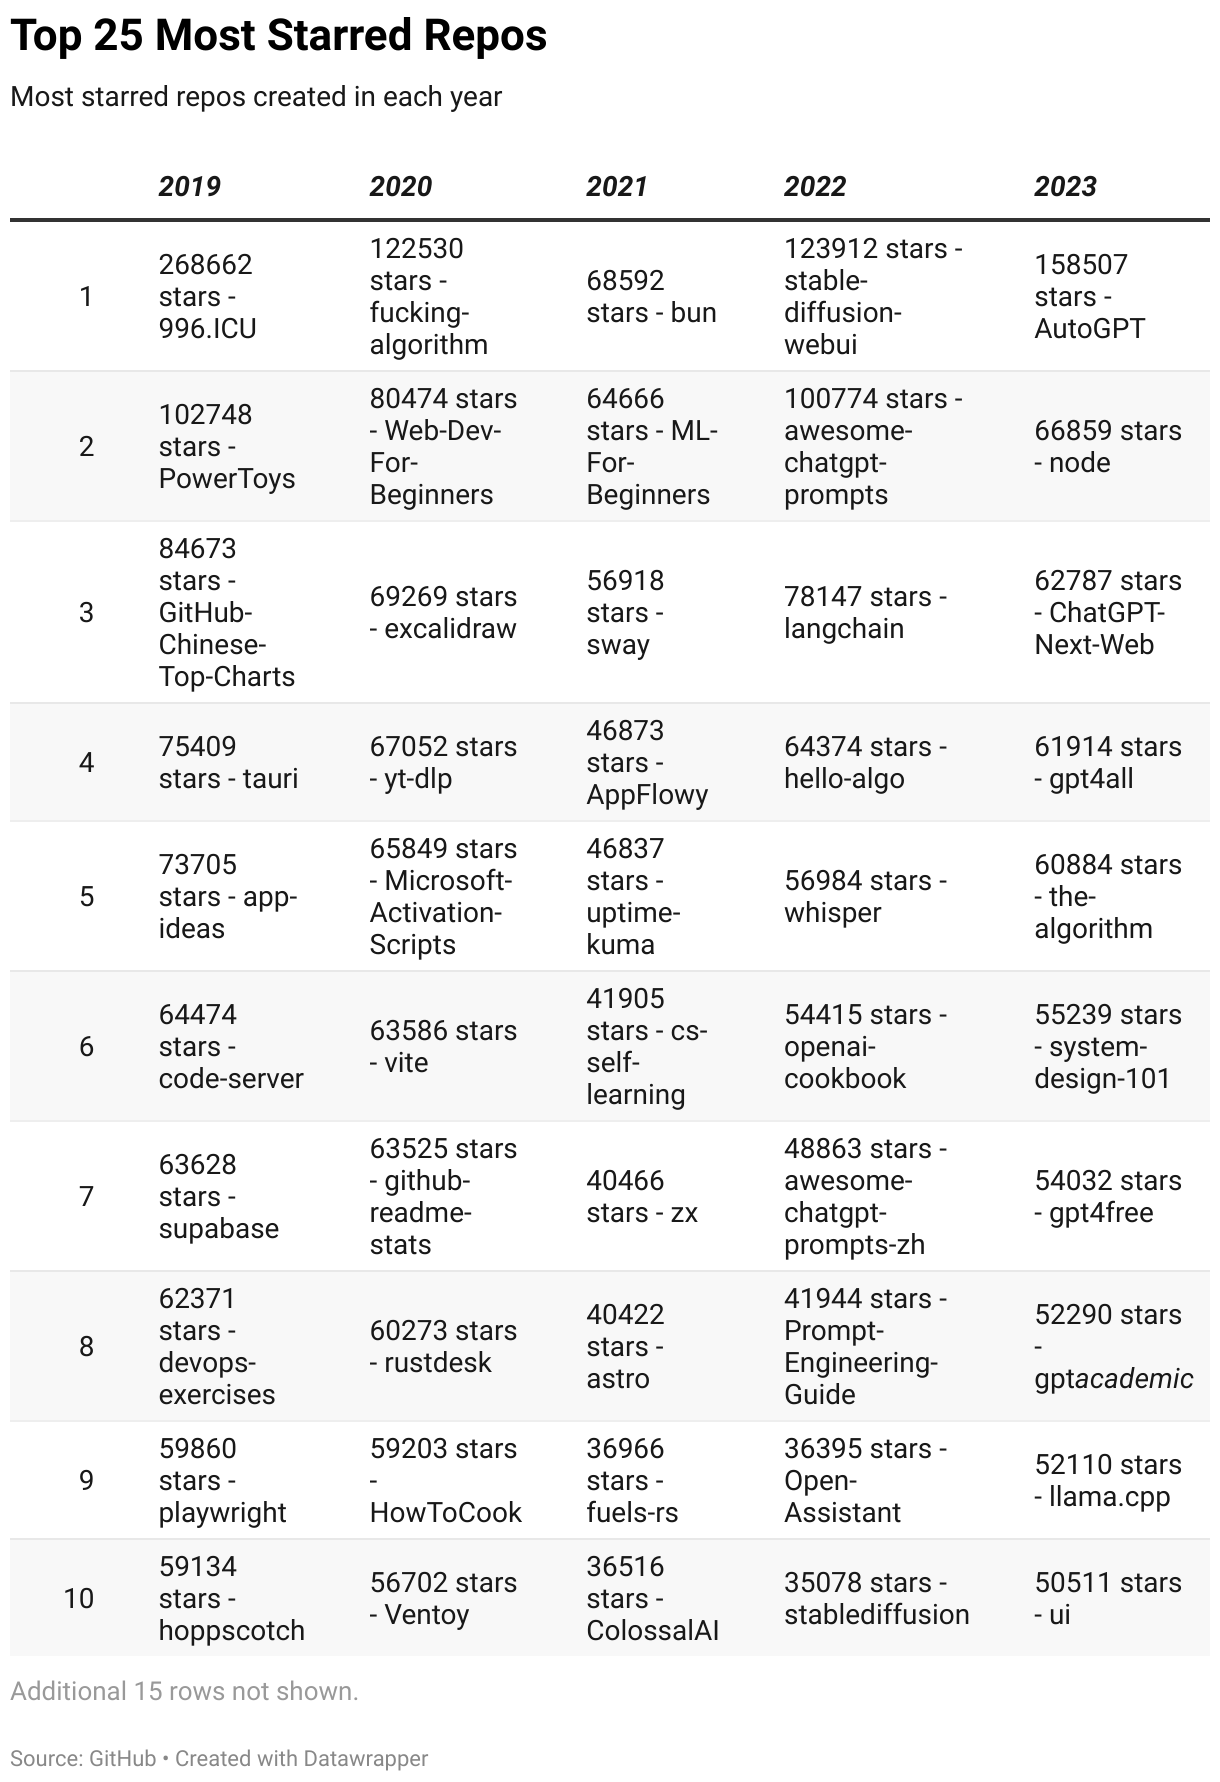
For fun, here’s a table of the most starred repos in the last 5 years:
Users can annotate their repos with topics, which gives us some interesting details on prevailing themes/languages/categories.
We almost have as any unique topics as we do repos, which I think is kind of interesting.
Of the last 5 years, these are the 25 most popular topics

Here's the same chart but with a 5,000 star cutoff instead of 100

Anything stand out?
1. What is going on with Hacktoberfest? It's an annual month-long event that encourages people to contribute to OS. The reason why it's the top-ranking topic for high-star repos is because those projects already have a lot of visibility, and thus attract attention during the event. Note that topics can be added at any time, so a project like [Rust](https://github.com/rust-lang/rust) can have the tag, even if it wasn't started out as a Hacktoberfest project.
2. Python is the OS language king.
3. Typescript/Javascript parity, on the surface. But when I looked further, there's a clear trend of Typescript supplanting Javascript. In 2019, Javascript appeared 831 repos to Typescript's 620. In 2023, It was 364 for Typescript vs 243 for Javascript. And of those 243, 89 had a Typescript tag in addition. The people have spoken!
4. ChatGPT shows up in the 5k star chart! Yes, the chart completely changes in 2023.
The top-N charts for 2019-2022 look more or less the same. Then in late 2022 ChatGPT comes to the scene and completely shifts the attention of the open-source community. Take a look below


Craziness. The amount of attention towards LLMs in the Open Source is unlike anything we've seen with any other trend, at least with respect to open source project creation. I wonder how this compares to the early internet days.
In the full jupyter notebook, I also have some charts around exclusive topics (meaning topics appearing in year X but not year Y). I'm not going to add it here, but one of the topics I saw was "NFT", so I wanted to see how it does in all the years
Yikes! But not surprising.
It was also fun to look at the counts for AI related terms. Here's one
Note that people can add a topic to a repo whenever, so the pre 2022 repos didn't necessarily have that topic before ChatGPT came out.
Here's another way to look at the above discrepancy between 2022 and 2023 topics

AI topics dominate 2023, Language/Frameworks dominate 2022.
Last chart I have is around repo activity. In this case, inactive repos are those without a commit in the last 30 days.

Not too much to glean, except that many "ChatGPT" repos are toy apps, but fun to look at. The 10 point differential between GPT4 and GPT3 suggests people have moved onto the newer model.
Some repos add languages to “topics”, but there’s a more specific “language” field in the repo schema. Github uses Linguist to try and determine the “primary” language in a repo.
It more or less confirms what we’ve seen, primarily the outsized popularity of Python.

This chart is from all 5 years, but I also looked at each year individually. They mostly looked the same with 2 exceptions - one being that Python dominated 2023, going from around 23% of 2019-2022 languages to a whopping 34.5% in 2023. No doubt thanks to its monopoly in data science and AI and the onslaught of such projects in 2023. The other trend was the move from Javascript to Typescript, confirming what I mentioned earlier.
That's all I've got for now. Feel free to play around with the data and notebook. I'd like to shout out cursor.sh and ChatGPT/GPT4, who made it a breeze to create these charts. I mostly double checked the data and any calculations, but if you catch any mistakes, I blame AI!
Kidding of course - please let me know and I'll update mistakes.
X-post from https://vladrachev.substack.com/. Subscribe on substack to get these posts in your inbox.

